This page is part of archived documentation for openHAB 3.1. Go to the current stable version
# Metrics service
The metrics service provides
- an additional REST endpoint to retrieve openHAB core metrics from. This can be used as scrape target for pull-based monitoring systems like Prometheus (opens new window).
- optionally configurable services to export openHAB core metrics to push-based monitoring systems like InfluxDB (opens new window).
# Precondition
The openHAB core metrics must be available (at least OH version 3.1).
# Provided metrics
Currently the following metrics are provided:
- openHAB events counts (per topic)
- openHAB bundle states
- openHAB thing states
- openHAB rule runs (per rule)
- openHAB threadpool stats (per scheduler)
- JVM stats including metrics of
- class loader
- memory
- GarbageCollector
- OS (system load, CPU)
- thread metrics
# Configuration
The configuration for the metrics service is available in the openHAB UI under Settings | Other Services | Metrics service. Support for pull-based monitoring systems (e. g. Prometheus) is always enabled, since it doesn't imply any significant overhead when not used. Support for push-based monitoring systems (e. g. InfluxDB) have to be enabled separately.
The following configuration parameters can be set:
| Config param | Description | Default value |
|---|---|---|
| influxMetricsEnabled | Enable the Influx (www.influxdata.com (opens new window)) metrics. Further configuration of the InfluxDB instance necessary. | false |
Refer to the corresponding monitoring system sections for monitoring system specific configuration parameters.
# Supported monitoring systems
For a start, the following formats are supported:
# Prometheus
Once the IO addon is installed, the Prometheus endpoint will be available under: <openhab_host>:8080/rest/metrics/prometheus
Refer to the Prometheus (opens new window) documentation on how to setup a Prometheus instance and add a scrape configuration. A typical scrape config could look like this (excerpt from /etc/prometheus/prometheus.yml):
scrape_configs:
  - job_name: 'openhab'
    scrape_interval: 1m
    scheme: http
    metrics_path: /rest/metrics/prometheus
    static_configs:
    - targets:
      - 'openhab.local:8080'
Replace openhab.local by the openhab host.
# Available configuration parameters
There are no Prometheus specific configuration paramters.
# InfluxDB
The InfluxDB exporter service will start as soon as the influxMetricsEnabled configuration parameter is set to true.
# Available configuration parameters
| Config param | Description | Default value |
|---|---|---|
| influxURL | The URL of the InfluxDB instance. Defaults to http://localhost:8086 (opens new window) | http://localhost:8086 (opens new window) |
| influxDB | The name of the database to use. Defaults to "openhab". | openhab |
| influxUsername | InfluxDB user name | n/a |
| influxPassword | The InfluxDB password (no default). | n/a |
| influxUpdateIntervalInSeconds | Controls how often metrics are exported to InfluxDB (in seconds). Defaults to 300 | 300 |
# Additional metric formats
The metrics service was implemented using Micrometer (opens new window), which supports a number of monitoring systems (opens new window) It should be possible to add any of these, especially the ones using a pull mechanism ("scraping") like Prometheus does.
# Grafana
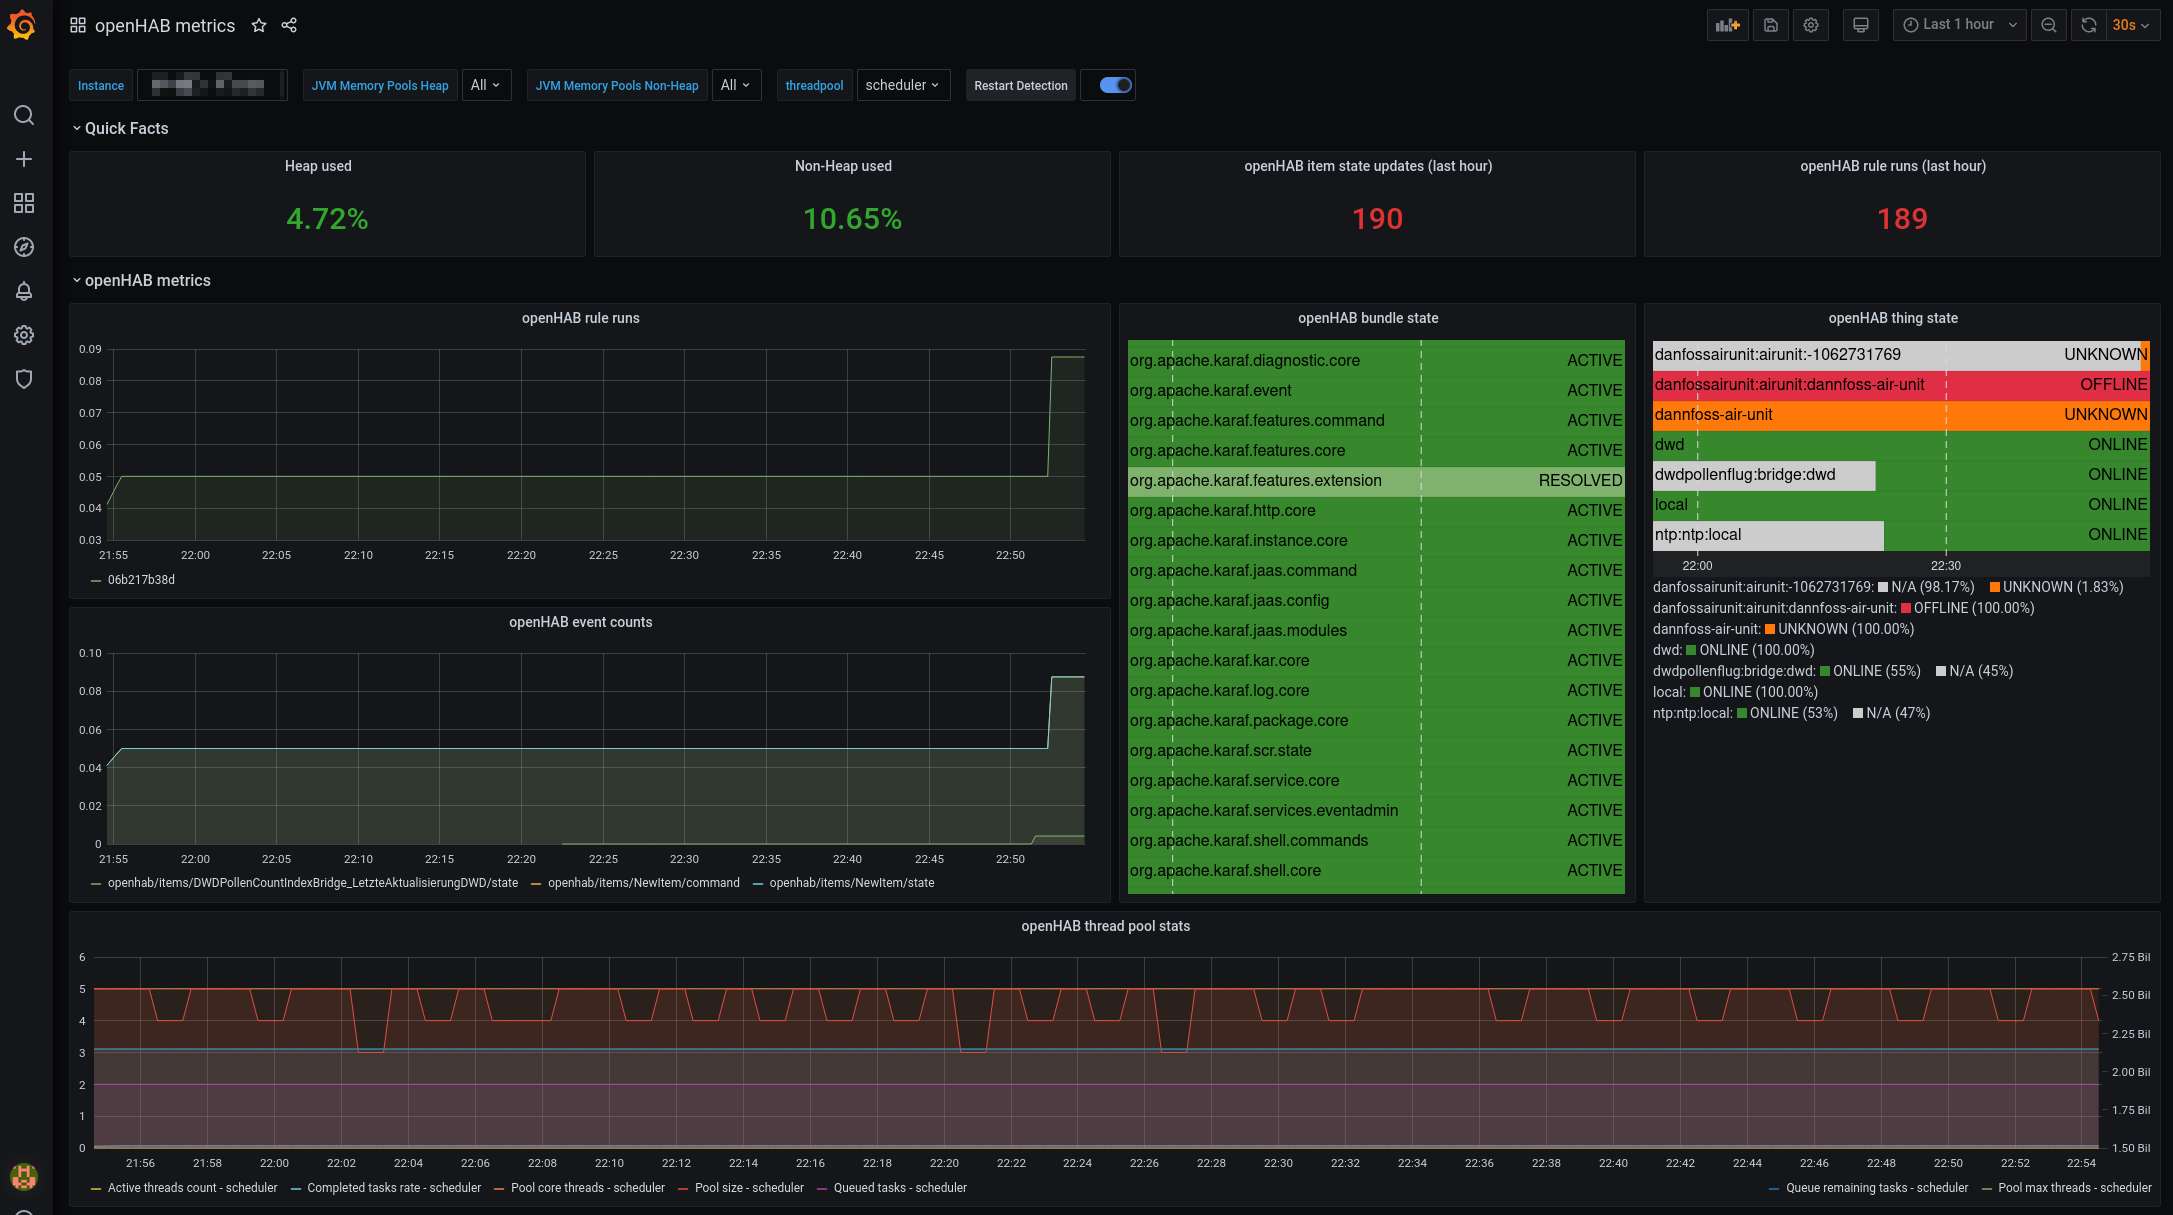
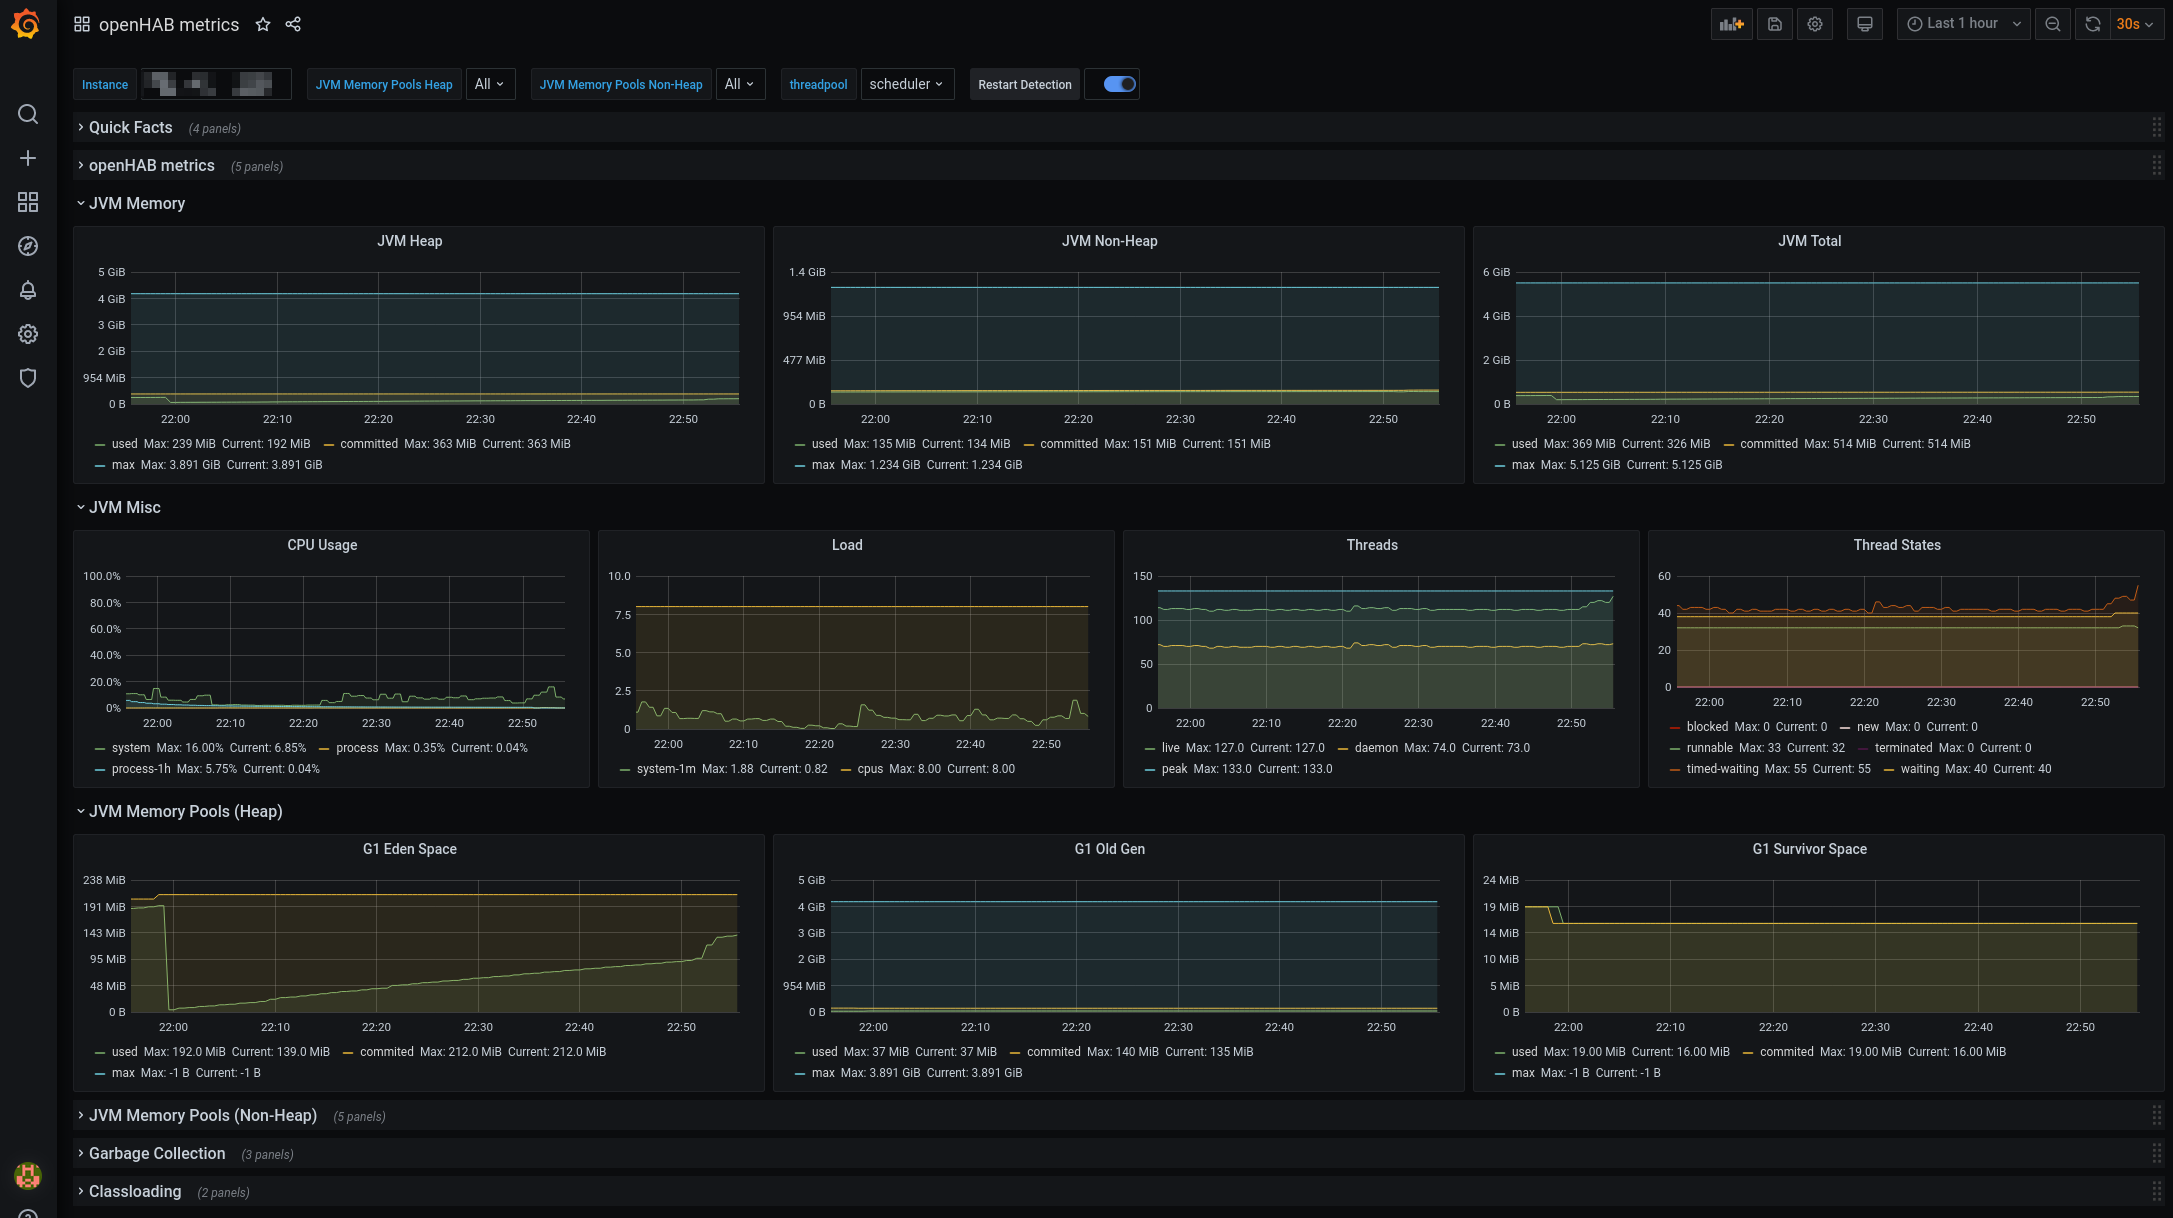
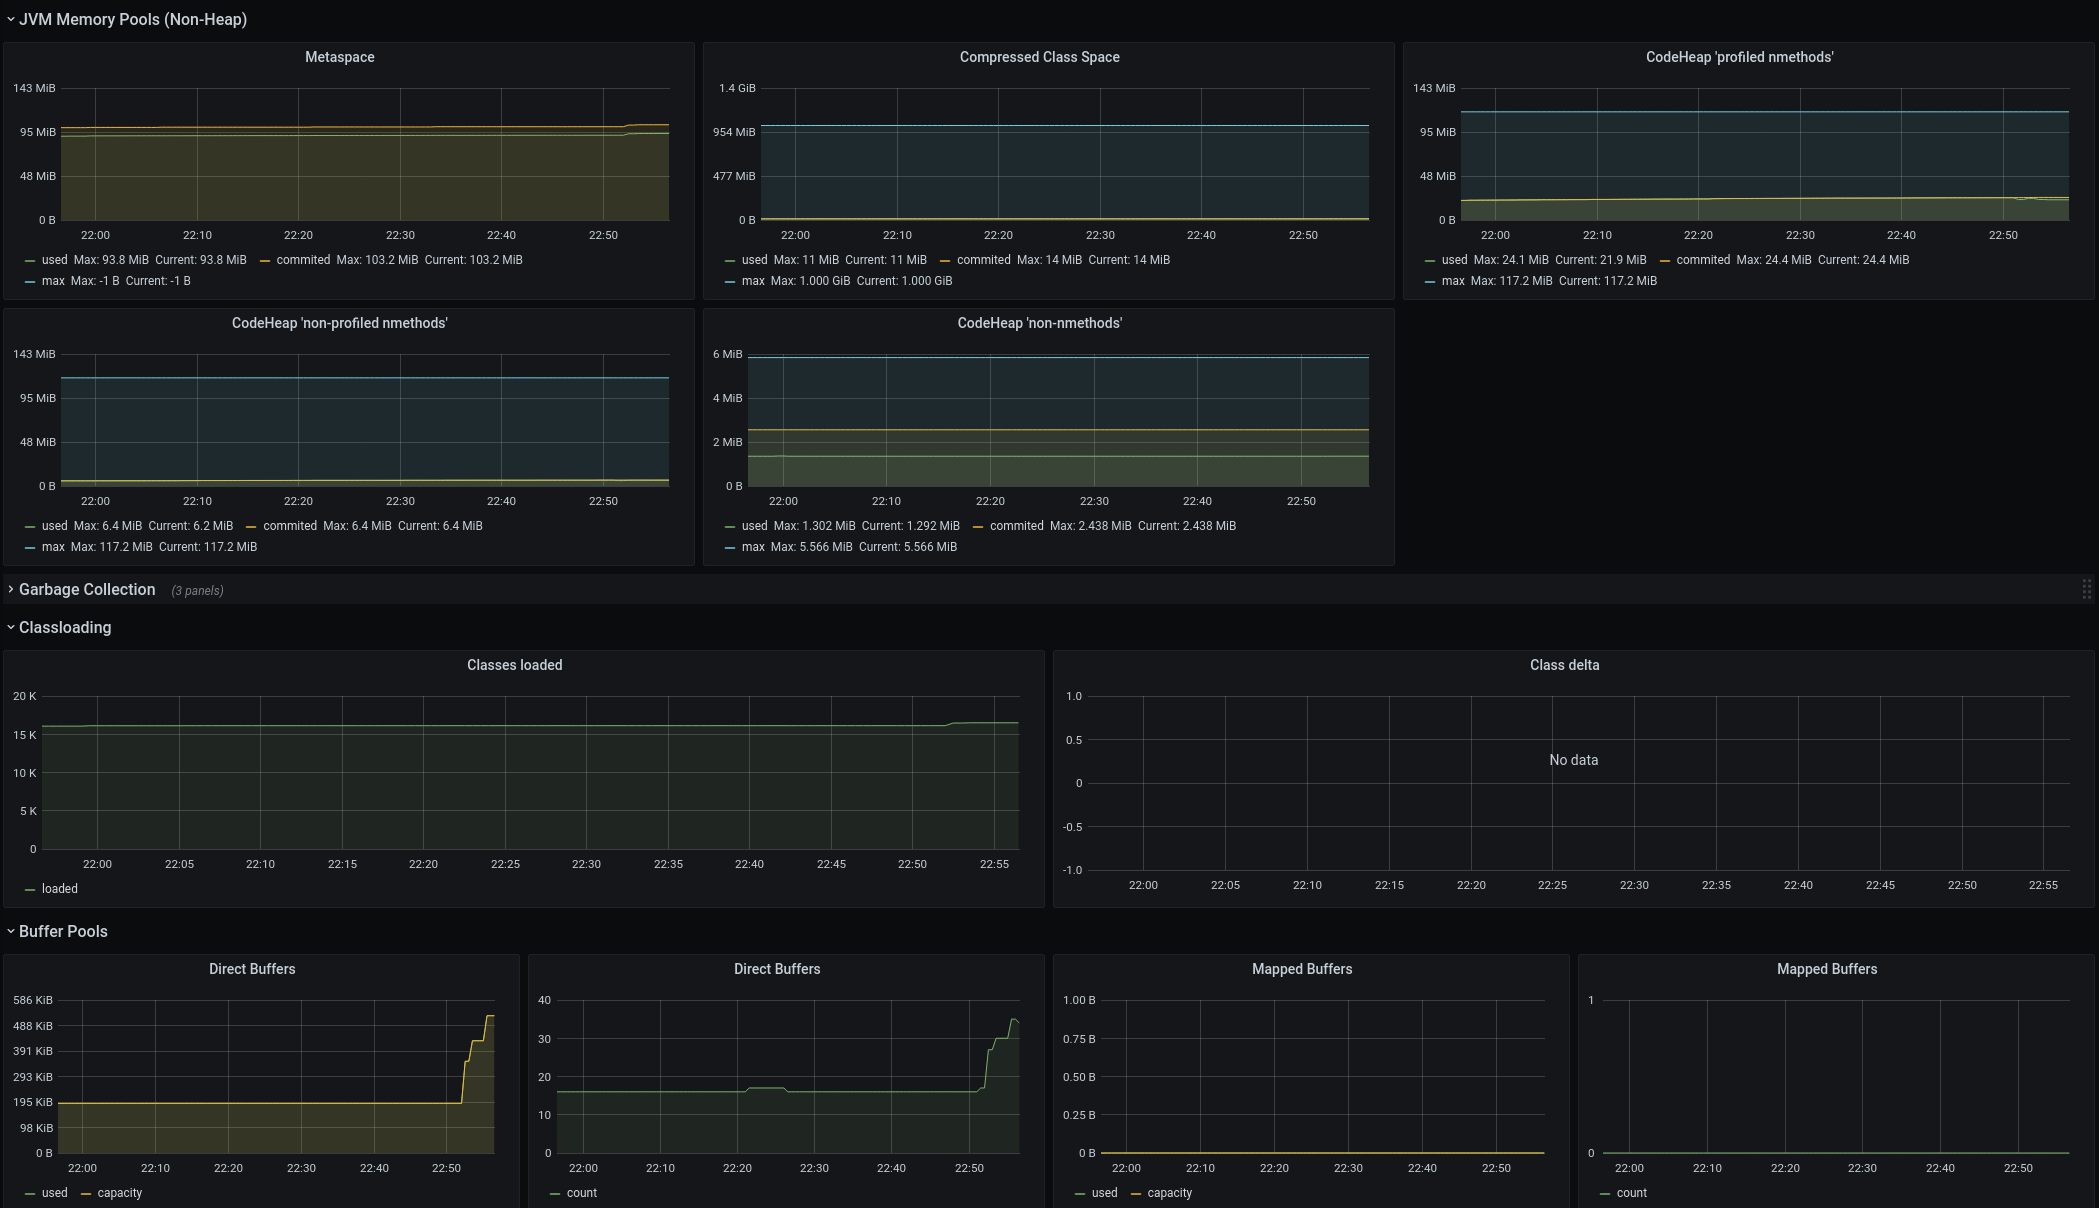
You can now visualize the results in Grafana. Micrometer provides a public Grafana dashboard here (opens new window). I adapted it a little bit to include the openHAB metrics. You can download it here Dashboard. This has been tested with Prometheus - for other monitoring systems adaptions to the dashboard might be necessary.
Here are some screenshots:


